You should focus on customer retention, here's why

GET THE #1 EMAIL FOR EXECUTIVES
Subscribe to get the weekly email newsletter loved by 1000+ executives. It's FREE!
If you run a business, a product company or a consultancy then this article is important to you. If you have ever heard of the term product market fit then this article is important to you.
A lot of people are vague about what the definition of product market fit is. It's a term that gets thrown around a lot, but what does it actually mean?
Well let's bring in 2 of the best in the business to explain retention and product market fit.
- Dalton Caldwell - Partner at Y Combinator
- Alex Schultz - Head of Growth at Meta
If we are talking about products, retention is a good way to keep everyone intellectually honest. As @dflieb says "logs don't lie". Looking at topline growth alone with an eventual plan to "fix retention" is tricky.
Meta goes a step further, here's the head of growth.

That is worth repeating - retention is The single most important thing for growth! It's quite refreshing hearing such clear advice. So let's graphically break down what he is saying.
Second point you have product/market fit for some subset of market. This is important! This is a sign that product market fit is actually something that can be graphed.
We are going to plot
- Time on the x-axis
- Retention on the y-axis
In simple terms retention counts the number of users who return to your product over time.
Let's plot good vs bad retention:
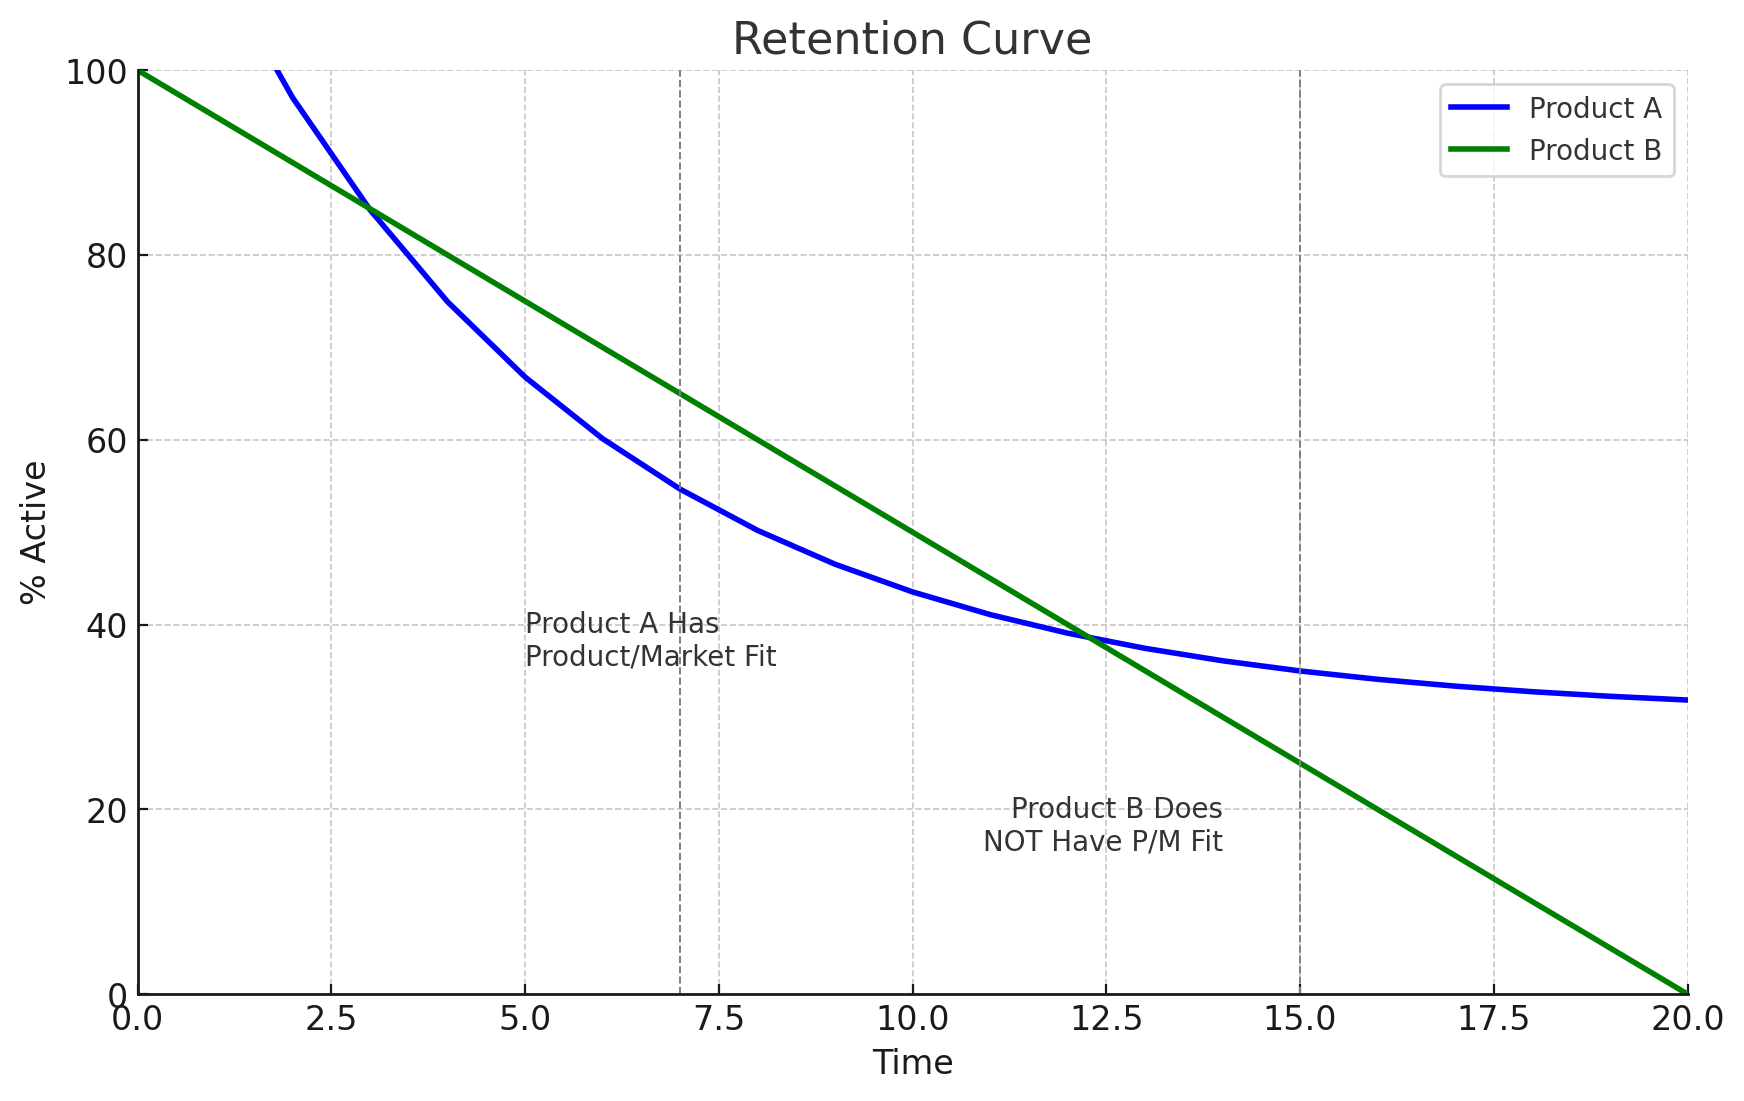
This graph shows that good retention is when the curve flattens out, meaning users are sticking around.
This also means that you have product/market fit for some subset of market.
Bad retention is when the curve drops off, meaning users are leaving. The goal is to get the curve to flatten out as soon as possible. This is the key to long-term success.
Why does he say 'some subset of market'? It's because retention curves are usually looked at in cohorts. A cohort is a group of users who signed up at the same time.
The other types of cohorts are by channel, by country, by device, by age.
This is more of a factor in large companies, but it's still important to understand.
So if we know that good retention is important, then how do we achieve it? Let's break it down.
Framework for Growth
Acquisition
- What do people want to achieve with the product?
- How can we get users to experience the service quickly?
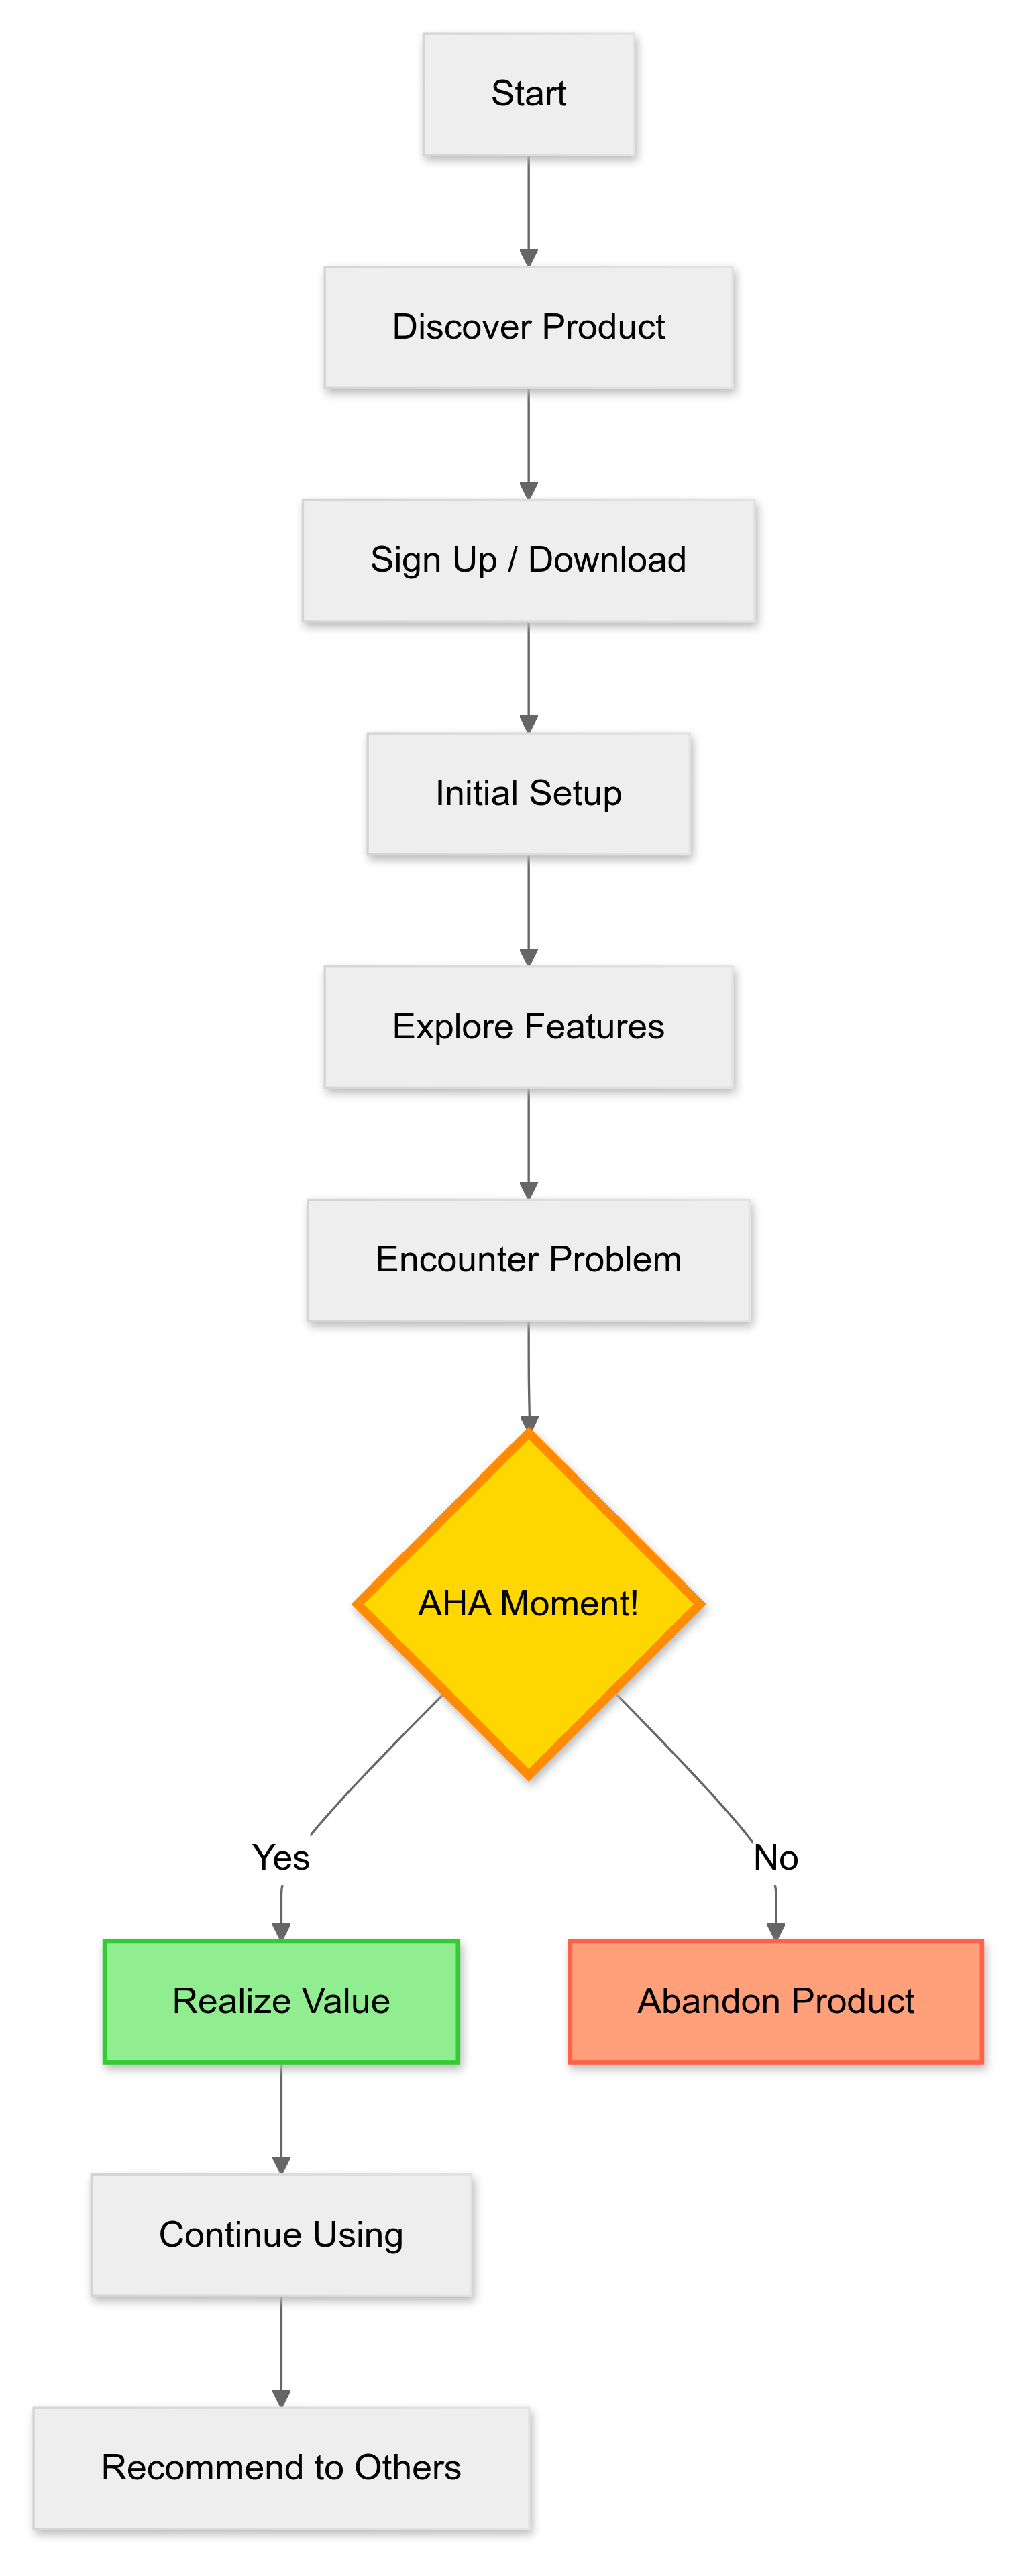
Activation (The AHA Moment)
- What is the key moment when users realise the product's value?
- How can we get users to that moment as fast as possible?
Engagement
- How can the business consistently deliver core value to users?
Removing Friction for Growth

The growth team's job is to eliminate any unnecessary friction in the customer acquisition process. If unnecessary steps are blocking the path to that A-ha moment, it's time to remove them.
That Means
- Making the sign-up process as simple as possible.
- Reducing the number of steps to get to the A-ha moment.
- Ensuring the product delivers core value consistently.
- Being clear on what the A-ha moment is.
Key Considerations
- Focus on Strengths: It's easier to build on a strength than to improve a weakness. For instance, LinkedIn targets active users with "Who’s been viewing your profile" emails because they're more likely to engage.
- Desire vs. Friction: Conversion is driven by balancing desire and friction. It's easier to reduce friction than to create desire.
- Incremental Gains: Apply the 10% rule—assume you can increase conversion rates by 10% for each channel. How many more users would that bring in?
- A/B Testing: Once you find a flow that works, use A/B testing to optimize it. This approach fosters a culture where data trumps opinions, though it will guide you to a local maximum, not a breakthrough change.
Examples of Retention Curves
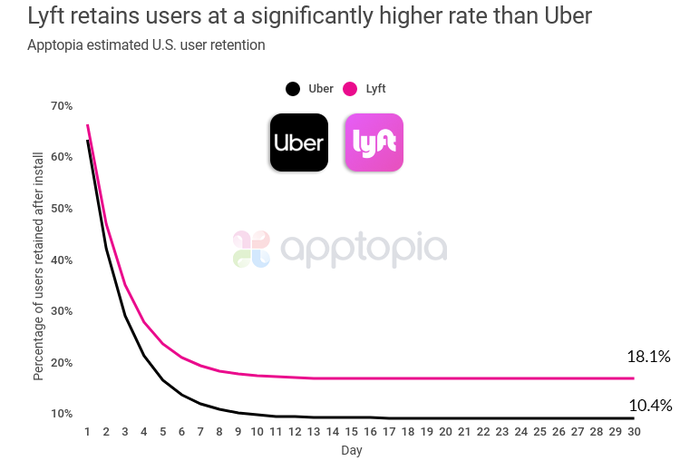
This is what some retention curves look like for real products. First up we will have Uber vs Lyft.
This graph might suprise you, as the retention numbers seem extremely low.
The key thing is that even though they are low, they are flattening out. This is a good sign. You can build a billion dollar business as long as the curve is flattening out.
Yesterday I posted image of @lyft's DAUs gaining on @Uber's in the United States. Today, I'm showing you the retention curve that leads to Lyft growing faster than Uber, even with fewer downloads. blog.apptopia.com/lyft-is-on-pac…
Now let's look at some streaming platforms retention curves.
Again it might be suprising how these dip. Right now you can see that Apple TV has a significant drop off relative to Netflix. If you were the CEO of Apple, you would want to understand why is this happening.
It's showing that your product market fit isn't a strong as netflix and you need to investigate why. Because it's dropping off after 7 months it probably signals that the product isn't delivering the core value that users are looking for.
A large number of products
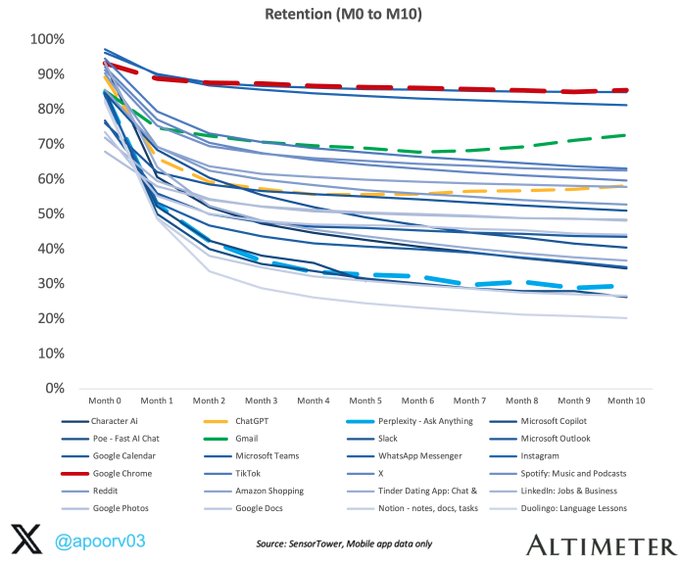
This graph though difficult to see the different colours shows retention curves for a large number of products.
Google Chrome has a very high retention rate, which is a good sign. It's a product that people use every day.
This is also a helpful benchmark for you to compare your product to.
Smiling! 😀 That's what @ChatGPTapp @perplexity_ai @gmail & @googlechrome retention curves have in common. Smiling retention curves are rare - users are returning after initially churning! Full analysis: apoorv03 dot com
Actionable Steps for Executives
- Ensure you have retention curves in your business. If you don't, start tracking them.
- Identify the A-ha moment for your product.
- Streamline the sign-up process to eliminate unnecessary steps. Challenge the team to think about how to make it simpler.
- Look at how easy the sign up process is for other products. How can you make it easier?
- Continuously monitor the retention curves.
We get bought in a lot to help businesses fix their retention curves. It's a common problem that we see. If you are struggling with this, then reach out to us.
